
The word is “exponential”. It’s been showing up on my students’ tests and in their lab reports. And, like Inigo Montaya, I have to say: I do not think it means what you think it means.
In particular, it does NOT just mean “curving upward”. When you state that a graph is “exponential”, you are making a very specific claim about the structure of that graph and the mathematical relationship it depicts. Some curved graphs turn out to be exponential. But not all of them. (And in fact, not this next one.)
What got me started on this year’s version of this rant:
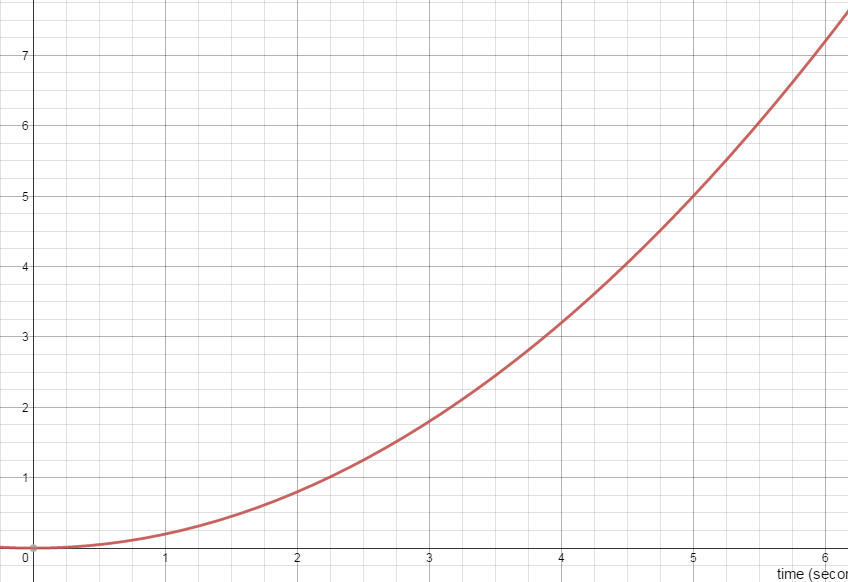
Here is a position vs. time graph from my student’s first test of the year.
One of the questions that I ask about the graph is:
“Between t = 0 seconds and t = 6 seconds, was the car accelerating? How do you know?”
I am hoping for (and giving full credit for) answers like:
Yes. The slope tangent line is getting steeper.
OR
Yes. If the velocity were constant, the graph would have been linear.
But I am also seeing a surprising number of papers that say:
It’s accelerating because the graph is increasing exponentially.
I don’t take off credit (yet) but I do wish we could sort this one out. So let’s try.
A Function is Exponential…
only if it can be written in the form: y=a·bx
where a and b are constants and x is the exponent.. And as long as b is greater than 1, the graph of the function will in fact curve upward. For example, here is the graph of a function that is in fact exponential. I don’t want to reveal what function it is just yet.
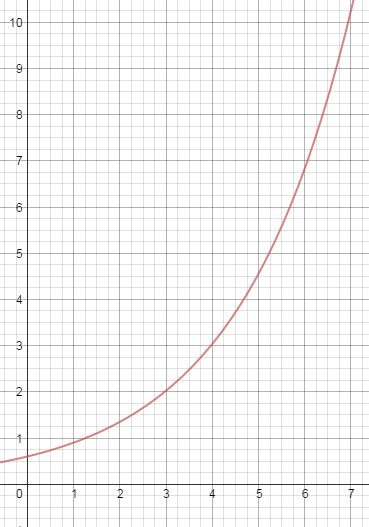
And here is a quick way to see if the function is exponential: look at how much it increases in equal x-intervals. A linear function will increase (or decrease) by the same amount in each interval. But an exponential function will increase (or decrease) by the same factor in each interval!
So now let’s take a look at the values of this function at regular intervals. In this case, I’ll just use Δx =1 and I’ll read the values off the graph as best as I can.

As you can see, as x increases, the function increases, but not by equal amounts. That’s ok — we weren’t expecting equal increases. The function is not linear.
But if you calculate the ratio of any two successive values, you do see that the function is increasing by (nearly) the same factor every time! (You can trust me, or you can actually do the math.) This means that you are justified in suspecting that this curve really is “exponential”. And you can figure out the equation by inspecting the graph and chart. I’ll call that a puzzle — leave your answer in a comment (or if you are my current student, you can also post your answer in our class stream).
So let’s take another look at the first graph:
Let’s check on how much this graph increases each interval. Here’s the data:

Some things to notice:
1. The values increase, but once again, not by the same amount each interval. This one is not linear either.
2. The ratio of successive terms is NOT constant. Try it and you will see. This graph is NOT exponential.
But there is a pattern to be discovered here. Instead of finding the ratio of successive terms, try calculating the difference. You will discover a pattern, one that is true for “quadratic” functions. Tell me about it in the comments if you like.
tl/dr?
Bottom line: curved does not automatically mean exponential. Exponential means increasing by equal factors in equal time intervals.