
When we examine the graph of your accelerating hair growth, it’s easy to show that the growth rate is increasing. We can examine average growth rates for successive time intervals.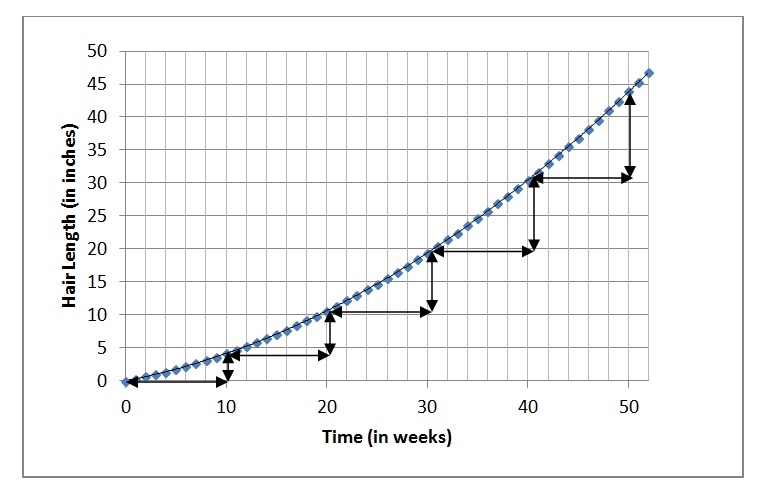
For example, we could choose to look at 10-week intervals, calculating rise over run for each interval. You should check for yourself to see that the average growth rate increased from just under 0.5 inches/week over the first 10-week interval to nearly triple that rate over the fifth 10-week interval.
Those are still just average rates. But what if you wanted to know how fast your hair was growing right NOW!? Not over a finite interval but at a specific moment. There is a way to answer that question too. But you may have philosophical or mathematical objections. “If no time passes, how can ANYTHING have a rate of change?”
The way we answer this kind of question is by making use of the idea of a limit. Essentially, to find the slope at a given point, we start by finding the slope between two different points: the point we were asked about and another point a little later. But then we move that second point closer to the first one. How close? Reeeeeeeally close but not all the way there. And as it gets closer, we look to see if there is a value that the slope approaches. If so, we use that value as the instantaneous rate of change.
There are many websites that explore this concept in greater depth. And they have some nice animations. Here are a few:
http://clas.sa.ucsb.edu/staff/lee/Secant,%20Tangent,%20and%20Derivatives.htm
http://www.math.umn.edu/~garrett/qy/Secant.html
http://www.slu.edu/classes/maymk/Applets/SecantTangent.html
Here is an animation taken from the first website listed above:
UPDATE: Now that I have discovered Paul Seeburger’s applet, here is a nicer look at that same idea:
I will leave most of the details for your math teachers to explain. But I will point out that this is exactly why they want you to learn about limits. Limits are the mathematical way to say “reeeeally close but not all the way there”. It’s reasonable to say that limits were invented as a way of dealing with precisely this question: how do we find the slope of a line at a given point?
As your physics teacher, I want you to know two ways to deal with this question.
1. WITHOUT CALCULUS
Here is a graphical method that will give us an approximate answer:
(This is the method I use with my 11th graders.)
Use a ruler to draw a tangent line. The slope of that tangent line is also the instantaneous rate of change.
So let’s say you wanted to how fast your hair was growing at the end of week #20. (Note carefully: we are not looking for the average rate over the first 20 weeks. We are looking for the instantaneous rate exactly at t = 20 weeks! It’s a different question.)
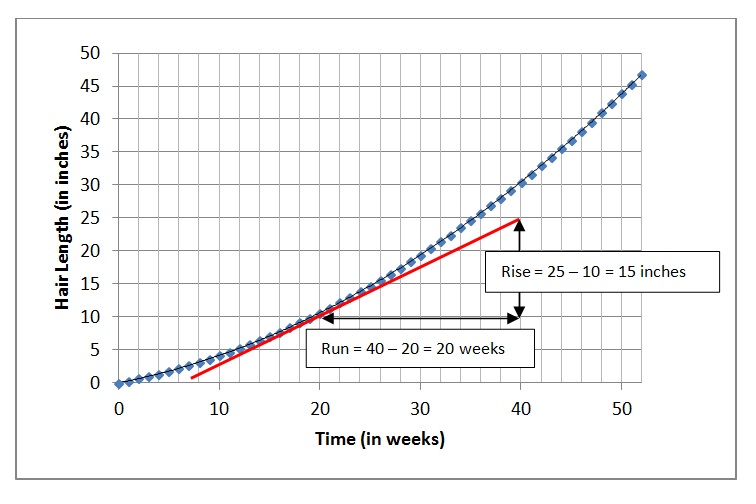 After you draw the tangent line, you choose any two points on that line and use them to calculate rise over run. So, using the values we get from the graph above, we calculate that the slope of the tangent line is (15 inches)/(20 weeks) = .75 inches/week. So now we know:
At week #20, the instantaneous velocity of hair growth was .75 inches/week.
2. WITH CALCULUS
The point of the entire discussion up until this point has really been to remind you about the idea of slope as a rate of change and to introduce (or re-introduce) what we mean by instantaneous rate of change. But I don’t expect that we will be drawing many tangent lines by hand during AP Physics. When we need to know the slope of a graph, there are formulas for that kind of thing. We’ll start looking at those formulas in the next post.