By the end of this post, you will know what a derivative is. You won’t know how to find one yet, but you will know what you have if you are given one!
Let’s say that we were given a function such as f(x) = x3 -4x.
We know it isn’t a linear function so when we graph it, we are not surprised to see the curves. And if you can imagine a tangent line “surfing” along the curve, the slope of the tangent line would clearly be changing as you went along. Here’s what I mean:
If you wanted to know the slope at a given point, you could estimate it by drawing the tangent line and then finding the slope of that tangent line (as we have seen in the last post).
But there is an alternative to that method that is useful and quick. When you have the rule for a function, there is a way to derive a formula for a new function that will give you the slope of the original function’s tangent line at any x-value you choose. Since it is derived from the original function, this new function is called “the derivative” of the original function.
For example, if the original function is:
f(x) = x3 – 4x
The derivative is written:
f’(x) = 3x2 – 4
The symbol f’(x) is pronounced “f-prime of x” and it is the most commonly used symbol to represent the derivative of the function f.
TWO THINGS YOU SHOULD NOT WORRY ABOUT (YET)
1. How did we get from the function f(x) = x3 – 4x to its derivative f’(x) = 3x2 – 4?
I will show you how to “take a derivative” in the next post. Once you learn a handful of rules, the process is not difficult. It’s easier than factoring. It’s easier than long division.
2. Why would anyone want a slope-finding formula ?
Once you know how to take derivatives, I can show you a variety of ways that they are useful. In fact, you’ll even get to use them forward and backwards! (That was supposed to be some fore-shadowing…)
For now, my goal is simpler. I just want to be sure that we understand what it is that the derivative formula tells us. And once again…it’s better with diagrams.
I made the graphs and videos in this post using a web-based applet written by Paul Seeburger, a professor of mathematics at Monroe Community College in New York. You can find the applet at:
http://web.monroecc.edu/manila/webfiles/pseeburger/JavaCode/DerivativeDemo2.htm
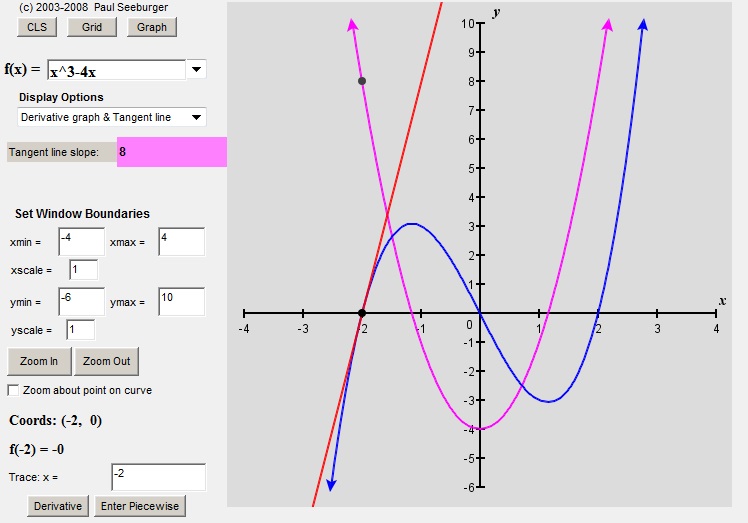
The blue line is the original function, f(x) = x3 – 4x.
The purple line is the derivative, f’(x) = 3x2 – 4.
The red line is the tangent line. You can calculate the slope of that tangent using rise over run if you want to, but you don’t have to. The applet does the calculation for you – look in the pink box.
Now let’s pick a point on the graph and examine all of the lines on this diagram.
At x = -2, f(-2) = (-2)3 – 4×(-2) = -8 + 8 = 0. This means that (-2,0) is a point on the graph of f.
At that same point, the tangent line has a slope of 8 (as you can see in the pink box).
If we plug x = -2 into the derivative formula, we get f’(-2) = 3(-2)2 – 4 = 12 – 4 = 8. And then, when you look at the graph of the derivative (in purple), you see that (2,8) is a point on that graph. So the derivative formula tells us the slope – at least at that one point. But does it always work?
Well, let’s look at another point: x = -1.
(If you are playing along at home, you can enter any x-value you want into the box on the lower left hand side of the applet where it says “Trace x =”)
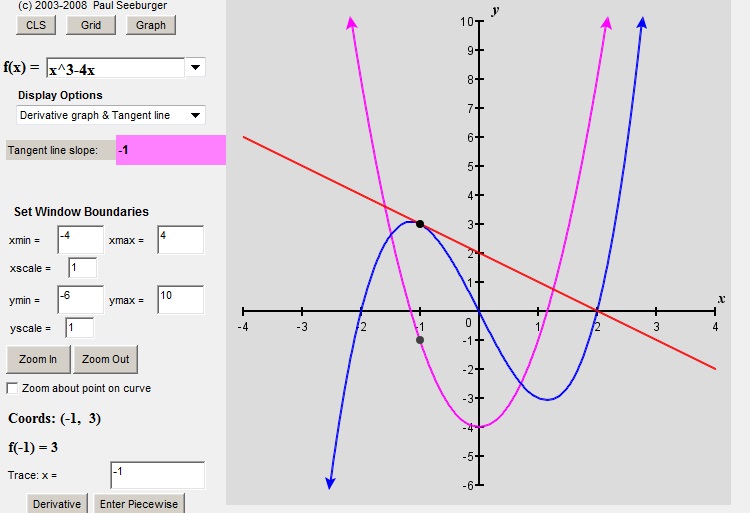
At x = -1, f(x) = (-1)3 – 4(-1) = 3. So (-1, 3) is a point on the graph.
Then, f’(x) = 3(-1)2 – 4 = -1. So we expect the slope of the tangent line to be -1, and it is. You can see that (-1,-1) is a point on the graph of the derivative (again, the purple one). So once again, the derivative formula has given the slope of the tangent line.
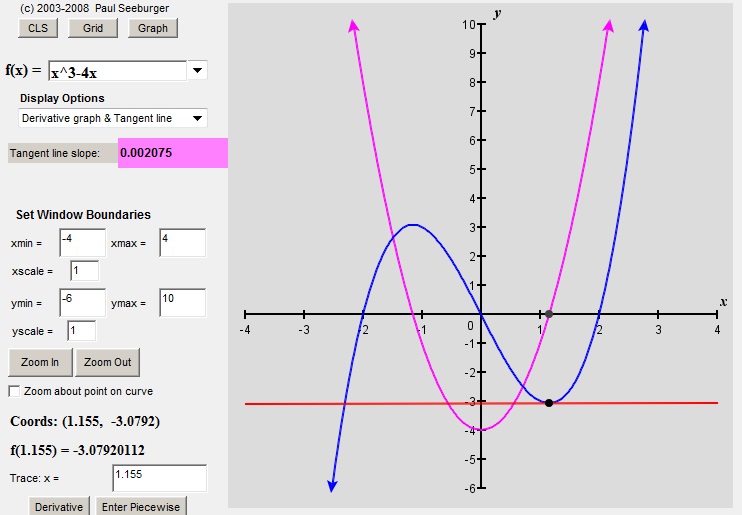
Here’s one more point that is worth noticing:
Look at the value of the derivative. And then look at the shape of the graph. Where the derivative is zero, the graph has a horizontal tangent. That little fact turns out to be a big part of one of the reasons why we care about derivatives. They help us to find places where the graph has a maximum or (as in this case) a minimum. We’ll be hearing more about that later.
So we have confirmed, at least for the points we checked, that for this particular function, the derivative formula does in fact give values that match the slopes of the original function’s tangent lines. If you want to, you can check many more points:
As you saw in the video above, Professor Seeburger’s applet lets you trace along the graph. As you do, the tangent line surfs along the curve and the applet keeps track of all of the values. Here is that video again, this time with the derivative function and the values all visible:
So if you are skeptical, run the video and then pause it wherever you want. You’ll see that the slope of the tangent line always matches the value given by the derivative. Derivatives really are slope-finding formulas.


Wow! Fantastic explanation! I learned about derivatives in my college Calculus class, but I don’t think it was ever explained to me so neatly. I definitely felt the emphasis on how to “perform” derivatives and less on “why.”