Another look at “Logarithms!”

OK, even I will admit that the logarithm rules do not seem to be infused with joy.  But once you know them, there is a way to apply them that my physics students seem to get a kick out of.  It’s a little exercise I learned by reading Professor David Mermin’s essay, “Logarithms!” in his excellent book, “Boojums All the Way Through” (Cambridge University Press, 1990).

The goal of the exercise is to be able to determine common (base-10) logarithms without a calculator.  At the time Mermin wrote, scientific calculators were actually not so common.  Now, everyone has access to them and Google will calculate them for you as well.  But that’s not the point.  It feels almost magical to be able to do this stuff without a calculator.  I would say it’s a hoot, definitely worth of the exclamation point Professor Mermin put in the title of his original article.

Here’s the basic plan.  Start by observing some coincidences, some “almost” equalities involving powers of small prime numbers and small powers of 10. Then use the logarithm rules to deduce the values of the logarithms.

[All of the examples that follow are from Mermin.]

For example, it happens that…

210=1024 and 103=1000

So we would be almost correct saying 210   = 103.

Then we could take the log of both sides, applying the power rule for logs to get:

10log 2 = log 1000

but we know that log 1000 = 3.

So 10log 2 = 3 and that means log 2 = 3/10 =.3

I have never presented this to a class without at least a handful of kids grabbing their calculators to see if we are close.  Their calculators tell them that log 2 = .3010 and I hear “Whoaaa!” (but I teach an impressively nerdy group).

Now what about log 3?  We need another coincidence, another “almost” equality.

While it is true that 32=9 which is almost 10, we can come closer with

34 = 81 which is almost 80.  This is helpful because 80 is also 10×2.

Starting from 34 = 10 × 23

we can take the log of both sides and actually enjoy ourselves as we apply the log rules to get:

4 log 3 = 1 + 3 log 2

And we already know log 2 — it’s (roughly) .3, which we can substitute in to get

4 log 3 = 1 + 3 × .3 = 1.9

log 3 = 1.9 ÷ 4 = .475

And when check out log 3 on your calculator, you see .4771….whoaaa.

We can get log 4 immediately from the fact that

Log 4 = log 22 = 2 log 2  ≈ 2 × .3 = .6  (whoaaa)

and log 5 = log (10 ÷ 2) = log 10 – log 2 ≈ 1 – .3 = .7 (Can I get another whoaaa?)

OK, I think you see the flavor of how this works now.  We just need to keep finding helpful coincidences…

Like 72 = 49 ≈ 50 = 100 ÷ 2.  Or  112 = 121 ≈ 120 = 10 × 2× 3.

These starting points expand our collection of approximate logs.  But you have to know your log rules to build the collection.

Mermin does not stop here.  He writes:

“Those whom the schools have taught to hate numbers will probably want to stop after this preliminary warmup, but the real fun is only beginning.”

He then goes on to improve on all of these estimated logs by constructing systems of equations built on closer, dazzling coincidences.  I recommend the essay and in fact the whole collection.


Lost In Translation — At Labyrinth Books in Princeton

In Advanced Math for Young Students, there is one section where I introduce a method to help students when they are stuck at the beginning of a word problem, not yet seeing how to translate the problem into the language of algebra.  Well, I have developed a workshop about this method and have been invited to present it at Labyrinth Books on Nassau Street in Princeton.

The presentation will be on June 11, 2015 at 5:30 pm.  If you are in the area, stop on in. But if not, check back here in mid-June.  I will post more about the method and include a link to the PowerPoint slides.

For more on the presentation:

http://www.labyrinthbooks.com/events_detail.aspx?evtid=827&loc=


For Small Angles Only

Two Surprising Trigonometric Almost-Equalities

Let’s warm up with an old math joke I first heard back in my own freshman year.  I have always thought it was funny even though I am not sure I get it.  But my students all LOVE my math jokes, so here goes:

post30pic8

I think it is meant to make fun of the way we sometimes do math in physics. For example…

When we are studying Young’s two-slit interference experiment, there comes a point when my students are asked to accept that for small angles, two things that they know are NOT equal can be sort-of, kind-of treated as equal:

sin(θ) ≈ tan(θ)

And when we are studying simple harmonic motion, I ask them to accept another one:

sin(θ) ≈ θ

That one is also only “true” when the small angles are measured in RADIANS (as you will see if you bravely read on).

Once you accept these two things, you can go on to derive other interesting rules about interference patterns and about the behavior of pendulums.  But why should anyone accept these things?  I’m going to give you a collection of reasons.

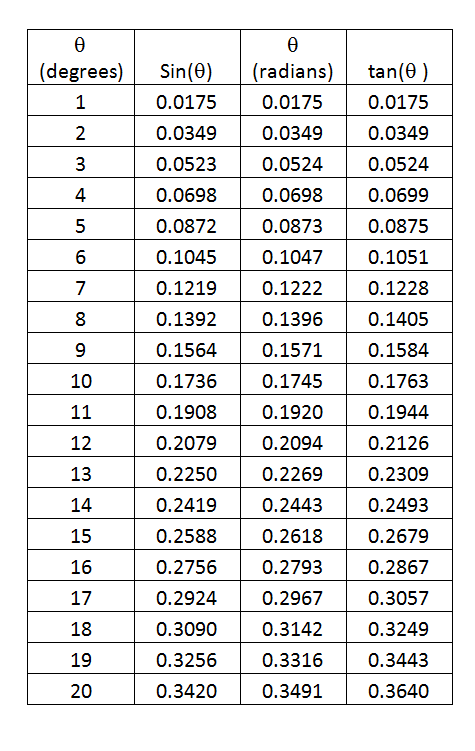
1. Look at the numbers.post30pic1

The chart above shows you values of the angle in degrees and then the sine, the radian value and the tangent listed in that order.  You can see that the values are close to each other.  The sine is a little less than the radian measure and the tangent is a little greater.  But even for angles as big as 20 degrees, the differences are less than 5%.  So just looking at the numbers, you have to accept that for small angles, these three functions — sin(θ), tan(θ) and θ — are equal-ish. 

2. Look at the Graphs

Here you see the graphs of the three functions graphed using the Desmos website:

post30pic2OK, clearly these are three very different functions.  But we are not interested in their entire domains.  We have only claimed that the functions are nearly equal for “small” angles.  So let’s just zoom in on the section of the graph from 0 to .4 radians…

post30pic3

Again, if we stay where the angles are small, the three graphs are “equal-ish.”

 3. Look at their Taylor Series Representations

This is something that students learn later in their first year of calculus.  These non-polynomial functions can each be expressed as a polynomials with an infinite number of terms.  And they can be approximated with polynomials of finite length.

How these polynomial formulas are developed and how much error you introduce by using only a finite number of terms are topics for several weeks of discussion in calc class.  But for now, let’s look at the first few terms of the Taylor polynomials for the sine function and the tangent function:

post30pic5

Notice that the first term is the same: it’s just ‘x’.  Then, after that, the next term has x-cubed.  But if x is already small, then x-cubed is going to be REALLY small.  Negligibly small.  As we already expect from looking at the charts and graphs, sin(x) is a little bit smaller than x and then tan(x) is a little bigger than x.  But for small values, the differences are negligible.

I know you are probably already convinced. But I have one more reason for you to believe this and it gives me an excuse to re-use one of my favorite diagrams…

4. Look at the Geometry

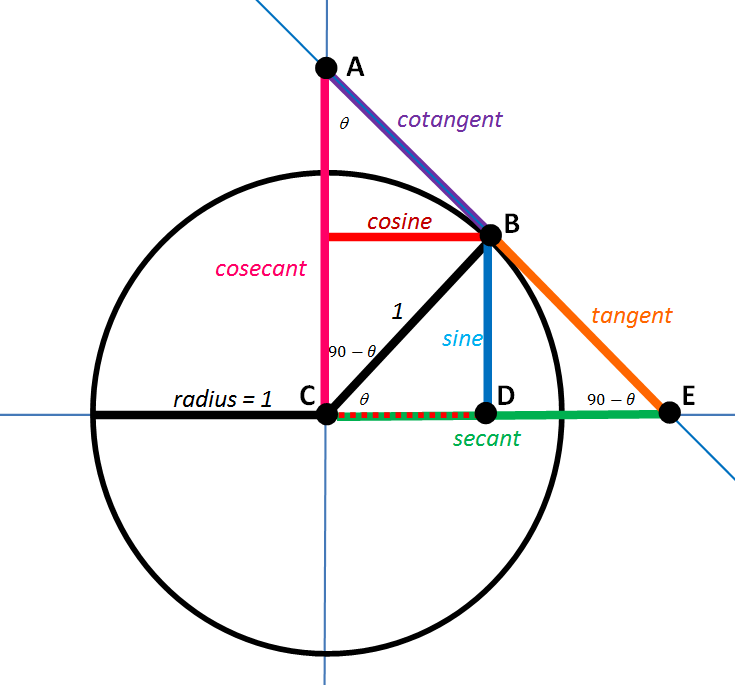
Here it is again:

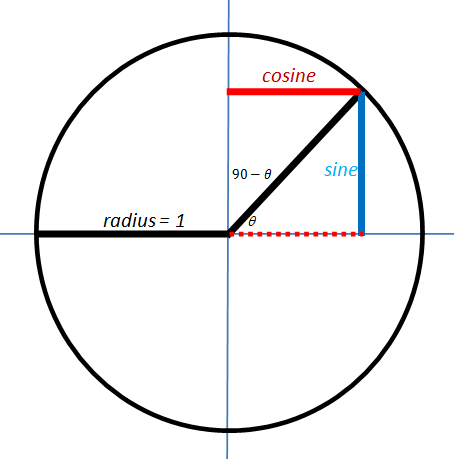
post27pic9

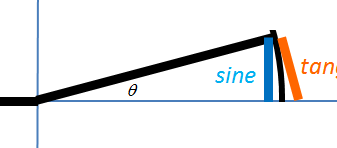
This was the diagram we used to learn the geometric meaning of all of the trig ratios.  Now I am going to make some changes to the diagram:  I am going to make the angle smaller and also I am going to delete any of the segments we don’t need right now.  Then I am going to zoom in on the part we care about:

post30pic7

The length of the blue segment is sin(θ).  The length of the orange segment is tan(θ).  And because it is a unit circle, the length of that intercepted arc is just θ.  (If you are not sure why that is true, think about the definition of radian measure — or read about it in this earlier post here.)

Now look at how the lengths of those two segments compare to the length of the arc.  One of them (the sine) is a little shorter.  One of them (the tangent) is a little longer.  But as the angle gets smaller and smaller, the differences become negligible!

Well, I hope one of these four methods have convinced you that this is legal.  If not, I hope at least that you enjoyed the joke at the beginning.


Invert and Multiply…but WHY?

Most of my posts so far have addressed high school level math.  This one is for younger students (and their teachers).

At another blog that I follow, Kitchen Table Math, there has been recent discussion about the “invert and multiply” rule for dividing fractions and whether it is important and/or appropriate to teach the reasoning behind this rule.

You know I am going to vote “yes”.  But what kind of derivation should we use here?

The rule can be derived algebraically.  But that doesn’t really help the grade-school students who are just learning it.  It can also be derived in a algebra-ish way.  A commenter at Kitchen Table Math pointed to the explanation found here:

http://www.moveitmaththesource.com/realfractions/mrnovaksproof.html

Mr. Novak’s explanation is elegant and concise. And it certainly answers the question: why do we invert and multiply in order to divide fractions?  But it would be nice if students also had an intuitive feel for why this works.

We can build the rule step-by-step in a manner that helps that intuition to develop.

Step 1: Division is for Sharing

You have 12 cookies – each a pretty good size —  and you need to put them in individual serving bags to hand out at a party.  By deciding how many to put in each bag, you also determine how many serving bags you can make.  For example, you could put 12 cookies in each bag, but then you would only have enough for 1 bag.  On the other hand, it you put 6 cookies in each bag, then you can fill 2 bags because 12/6 = 2. That seems obvious, but it establishes a method: we are going to divide the total number of cookies by the amount in each bag to find how many bags we can fill.  You soon notice that if you put fewer cookies in each bag, you can fill more bags.  For example:

If we take 12 cookies… And put 12 in each bag… 12 ÷ 12 = 1 We can fill  1 bag
If we take 12 cookies… And put 6 in each bag… 12 ÷ 6 = 2 We can fill  2 bags
If we take 12 cookies… And put 4 in each bag… 12 ÷ 4 = 3 We can fill  3 bags
If we take 12 cookies… And put 2 in each bag… 12 ÷ 2 = 6 We can fill  6 bags
If we take 12 cookies… And put 1 in each bag… 12 ÷ 1 = 12 We can fill  12 bags

So yes, dividing by a smaller number gives a bigger answer.  And with 12 cookies, 12 bags is the most you can fill…or is it?  I mentioned that these were pretty big cookies.  Hmmm…

 Step 2: Dividing by Fractions (of the “one over” variety)

You decide to put make the serving size a ½-cookie.  Since that serving size is even smaller, you expect to fill more bags.  Though you have not been taught how to divide fractions, you can do this one by thinking:

If I am putting ½ in each bag, then each cookie is enough for 2 bags.  So 12 cookies fill 24 bags.   I guess that must mean 12 ÷ ½ = 24.

Need to fill more bags?  Use smaller portions!  Give everyone 1/3 of a cookie…

You can see where this is going.  Let’s continue the chart…

If we take 12 cookies… And put 1/2 in each bag… 12 ÷ (1/2) = 24 We can fill  24 bags
If we take 12 cookies… And put 1/3 in each bag… 12 ÷ (1/3) = 36 We can fill  36 bags
If we take 12 cookies… And put 1/4 in each bag… 12 ÷ (1/4) = 48 We can fill  48 bags
If we take 12 cookies… And put 1/5 in each bag… 12 ÷ (1/5) = 60 We can fill  60 bags

The trend has continued.  Dividing by a smaller number gives a bigger answer.  And even if you don’t know the rule for dividing by fractions, you can certainly divide by these fractions!

To divide by “one over anything”, just multiply by the denominator.

 STEP 3: Any fraction at all!

Suppose you have those 12 big cookies and you decide to give everyone (2/3) of a cookie.  How many servings can you make?

We can figure this out using the reasoning we followed above, with one extra twist.

We have already seen that if you want to give everyone just (1/3) of a cookie, you will have enough to fill 12 × 3 = 36 bags.  But now you decide to give everyone TWO thirds of a cookie.  But you have already filled all those bags – why not just give everyone two of the bags?  You will have enough for 36 ÷ 2 = 18 servings.

Now go back and look at how we got that answer.  We don’t have to know an official rule to divide the 12 cookies into servings that each have 2/3 of a cookie.  We can just multiply by 3 and then divide by 2, which is the same as multiplying by 3/2.

Let’s try another:

Suppose you have 36 pizza pies to sell and you want to give 3/5 of a pizza to each customer.  (No one cuts pizzas into fifths, but don’t worry about that.)  How many customers can you serve before running out of pizza?

Well, if we give everyone ONE fifth of a pie, we can feed 36 × 5 = 180 customers.  Giving everyone THREE fifths means that we can only serve 180 ÷ 3 = 60 customers.

So to find 36 ÷ (3/5) we multiply by 5 and then divide by 3 which is the same as multiplying by 5/3.

Which derivation is “better”?

If I could only show students one explanation, I would go with Mr. Novak’s.  But if I had time to explore and play, I would start with what you see above.  I like that it encourages number sense and intuition.  Also, it introduces an idea that students will see again many times: that existing patterns can be extended to cover new situations.


Still Feeling Mean

Here’s a quick addition to that last post on various types of means.  By coincidence, yesterday, a question came up in my AP physics class about the meaning of the average radius of an ellipse.

We were looking at the laws that govern circular orbits.  But the orbits of planets are actually elliptical with the Sun at one focus.   The average orbit radius is the length of the semi-major axis. [When I first read that, it seemed wrong to me: how can the semi-major axis be the average distance — shouldn’t it be the greatest distance? But average orbit radius is average distance to the Sun, not to the center of the ellipse.  The Sun is at one focus so the planet distance is sometimes more than the length of the semi-major axis and sometimes less.  But that’s not the same thing as the average radius of the ellipse, which is the question that was asked.]

I’m not sure how useful it is to find the average radius of an ellipse, but it is interesting — and better with a picture!

ellipse

The distance from the center of a circle to any point on the circle is a constant — that’s the length of the radius.

The distance from the center of an ellipse to a point on the ellipse is not constant.  The longest it can be is the semi-major axis, a.  The shortest it can me is the semi-minor axis, b.  But what do we mean by the average radius?  One possible interpretation is that the average radius is the arithmetic mean of the two semi-axes.  But here’s another interpretation:

What is the radius of the circle that would have the same area as the ellipse?

Clearly, that radius would have to be more than b and less than a.  So maybe it is their mean…but which kind of mean?

To answer this, you need to know two formulas:

Acircle = πr2

Aellipse = πab

So if the two areas are two be equal, we need r2 = ab.

In other words…

For a circle to have the same area as an ellipse, the length of its radius must be the geometric mean of the lengths of the ellipse’s semi-major and semi-minor axes! 

I didn’t know that.  And I was surprised to see a geometric mean pop up in class so shortly after my last post.  Also, I should add: I don’t know how to show that the semi-major axis is the average orbit radius.  If any of my fine students can come explain that to me, it is certainly worth a little extra credit.

MEAN, MEAN, MEAN…

One of my very favorite students greeted me this new year with a question:  what are the different kinds of means?  This is a fun question to explore.  We are going to look at three kinds of means, each associated with a type of sequence.

Suppose we start with two numbers.   Their mean is a number that lies between them.  But exactly where it lies depends on what type of mean you are talking about.

If left unspecified, the term “mean” probably refers to the “arithmetic” mean.  So let’s start with that one.  (And by the way, helpful note for beginners:  “arithmetic” here is an adjective.  Read with emphasis on 3rd syllable.)

 ARITHMETIC SEQUENCES AND ARITHMETIC MEANS

A sequence of numbers is called arithmetic if the difference between any two consecutive terms is a constant.  For example:

2, 5, 8, 11, 14… has a common difference, d = 3.  (We calculate the current term minus the previous term.)

Say we have been given two numbers A and B.  We want to insert a number between them so that the three of them together form one of these arithmetic sequences. We are looking for the “arithmetic mean.”

We have A, x, B and we want the differences to be constant. 

That means we can write: x – A = B – x

From that we get: 2x = A + B

And then: x = (A + B)/2

This probably does not surprise you.  The arithmetic mean is also just the average. 

If A = 30 and B = 60 we get an arithmetic mean of 45, thus forming the sequence:

30, 45, 60

Then, if you check, you find the difference between consecutive terms is constant:

45 – 30 = 60 – 45 = 15. So the sequence is arithmetic.  45 is the arithmetic mean between 30 and 60.

Sometimes, this is the kind of mean we care about.  For example…

You drive for two hours at 30 mph and for two hours at 60 mph.  What is your average speed for the trip?   

When you solve this, you will discover that when you drive at different speeds for equal time periods, your average for the trip is the arithmetic mean of the two speeds.

 ANOTHER SEQUENCE, ANOTHER MEAN

A geometric sequence is one where the ratio between every two consecutive terms is constant.  For example:

1, 3, 9, 27, 81… is a geometric sequence with a common ratio of 3. (Now we calculate the current term divided by the previous term.)

So again we have been given two numbers A and B.  And now we want to insert a number between them so that the three of them together form one of these geometric sequences.  We are looking for the “geometric mean.”

We have A, x, B and we want the RATIOS to be constant. 

That means we can write: x /A = B/ x

Cross multiply to get: x2 = AB

And then: x = √(AB)

For example, if A=9 and B=16 then the geometric mean x = √(9×16) =√144  = 12.

We should check our work to see if the ratios are constant:

12/9 = 16/12 = 1.333… so yes, the sequence is geometric.  12 is the geometric mean of 9 and 16.

Sometimes, this is the kind of mean we care about.  For example, here is a problem you may have seen in geometry:
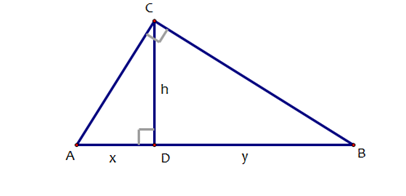
post27pic1

In the triangle above, if x = 9 and y = 16 determine the height, h.

You can use similar triangles to show that the height of that altitude is equal to the geometric mean of the lengths of the two segments on the hypotenuse.

 ONCE MORE, WITH HARMONY

A sequence is called “harmonic” if there is a common difference between the reciprocals of consecutive terms.  For example  (in fact, the classic example):

1, 1/2 , 1/3, 1/4, 1/5… is harmonic.  Its reciprocals are 1, 2, 3, 4, 5… which is clearly arithmetic with a common difference of 1.

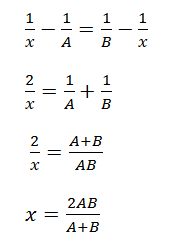
And one more time, we have been given two numbers A and B.  Now we want to insert a number between them so that the three of them together form one of these harmonic sequences.  We are looking for the “harmonic mean.”

We  have A, x, B and we want the difference of the reciprocals to be constant. 

That means we can write:
 post27pic2

So suppose A = 40 and B = 60. Their harmonic mean is:

 post27pic3

 To check our work, we have to look at the sequence of the reciprocals:

1/40, 1/48, 1/60… or, expressed over a common denominator,

6/240, 5/240, 4/240…sure enough, the reciprocals form an arithmetic sequence.


Sometimes, this is the kind of mean we care about.  For example, here is an SAT classic:

You drive to work at 40 mph and then you drive back home at 60 mph. What is your average speed for the trip?

You can solve this by calling the length of each leg d, finding the time for each leg of the journey, adding to get the total time and then using total time and total distance to find average speed.  When you are done, you are in for a surprise.  When you travel equal distances at two different speeds, your average speed for the trip is the HARMONIC mean of the separate speeds.  

I’ll close with a question: why is this called “harmonic”?  Does it have something to do with music and harmony? 

Happy New Year!

Trig Pictures, Part III

We almost have the whole picture in view.

Here’s where we left off:

post27pic8

In this diagram, the secant line segment is adjacent to the central angle θ.  And the tangent line segment is opposite that same angle.

But what if we want to draw our secants and tangents relative to the central angle 90-θ, the complement?  Let’s add those segments to the diagram and call them the cosecant and the cotangent.

post27pic9

EXERCISE #1

Find similar triangles and then use ratios to establish each of the following:

post27pic10

(If you need help getting started, I did the first two of these for you in the last post.)

EXERCISE #2

Find right triangles and then apply the Pythagorean theorem to establish each of the following:

post27pic11

Those two exercises reveal a lot of information all derived from that one diagram.  Once again…it’s better with pictures.

Picturing the Trigonometric Ratios: Step-by-step


Let’s start with the unit circle and a central angle θ that meets an arc on the circle:

post27pic1

The blue segment is called the “sine” of the angle.  It gets its name from a word that means “bowstring”.  Here is a diagram of a bow string truss.

post27pic2

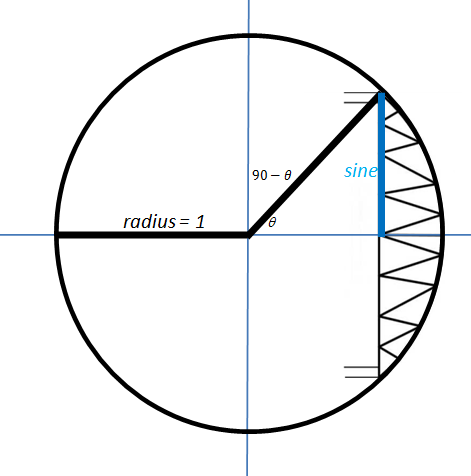
So if you think of the intercepted arc as the bow and focus only on the upper half…

post27pic3

… you can see how they first decided to call that segment the “bowstring.”

But you do not have to hold your bow vertically.  If you use the complementary angle, 90-θ, you get the horizontal segment I have drawn in red (and re-drawn on the x-axis as well…you’ll see why soon.)

post27pic4

We can call that red segment the “bowstring of the complement”, or the “complement’s sine.”  Or we could just call it the cosine!

Now we are going to add two segments to the diagram: one that just touches the circle and one that crosses the circle.  We will use the same names we used for these back in geometry class.  As you can see from the labels, the orange one is called the tangent and the green one is the secant.

post27pic5

Now, as we examine this diagram, we can find a number of interesting pairs of similar triangles.  To discuss them, it would be helpful if we label some points of interest:

post27pic8

Now we have arrived at the key step.

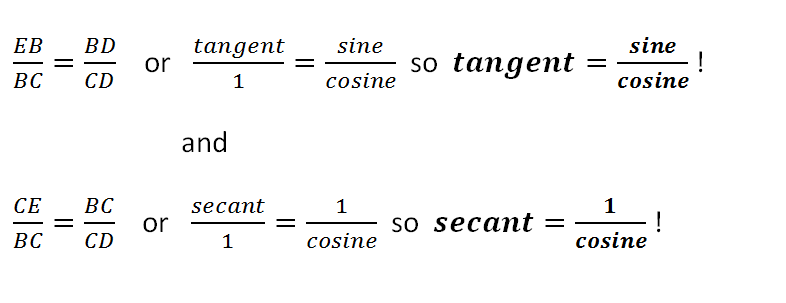
Take a moment to convince yourself that ΔEBC is similar to ΔBDC. 

Then, since similar triangles have proportional sides, it must also be true that:

post27pic7

These are NOT arbitrarily chosen definitions.  They follow by necessity from the geometric definitions of these terms.

I will pause here to allow everyone to catch their breath.  In the next post, we will finish developing the diagram and add in the Pythagorean identities.

Also Better With Pictures — The Trigonometry Ratios

One of the digressions we follow almost every time I teach AP Physics is intended to give my students a better visual understanding of the 6 basic trig ratios.  But it also resolves several mysteries left over from their first introduction to trig.

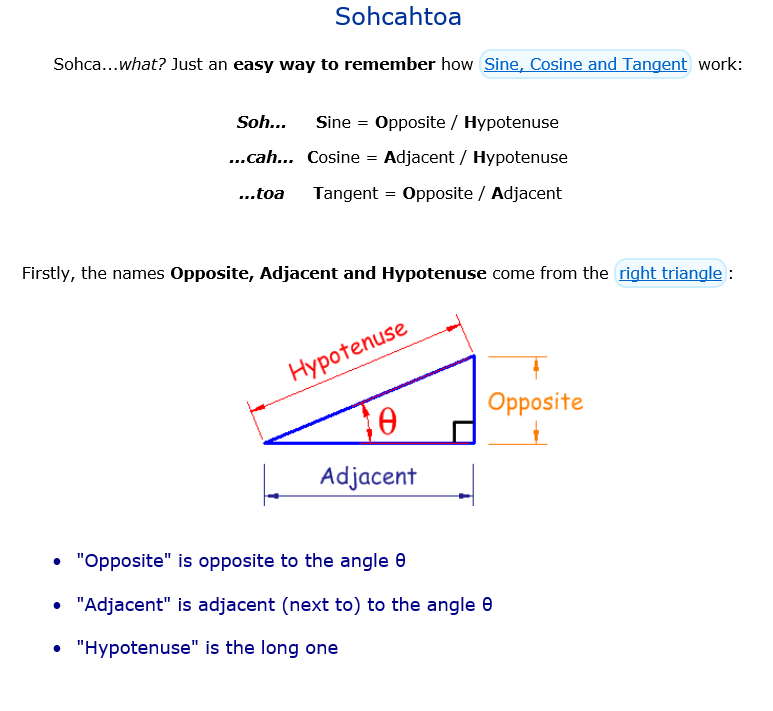
When you first learned the trig ratios back in geometry class, you were probably taught the mnemonic SOHCAHTOA.  You can also find this many places on the web.  For example, here is a summary from www.mathisfun.com:

post25pic1

Already, we have a bit of a mystery.  Students don’t know where the word “sine” comes from, but that’s fine.  Lots of new topics introduce new vocabulary without going into the etymology of every new term.  But what about “cosine”?  What is co- about it?  A minor mystery to be sure, but even so…

Then we tell them about “tangent”.  We say it is “opposite over adjacent”, which is the TOA in SOHCAHTOA.  And a tiny bit of algebra shows that the tangent can also be written as sine over cosine.  But we still have a mystery:

What is “tangent” about the tangent? 

This is not just an etymology question.  The word “tangent” is already part of our math vocabulary.  We saw in geometry that at tangent line is a line that touches but does not cross a circle.  There are all kinds of rules about the angles and the lengths associated with tangent lines (and secant lines too, for that matter).  But what does that use of the word have to do with the way we are using it now, here in trigonometry?

From there, we move on to the reciprocal trig ratios:

post25pic3

And now you have more mysteries:

What does this secant have to do with the secant we learned about in geometry?

In geometry class, a secant is a line that crosses a circle.  Is there some reason we are re-purposing this vocabulary?

And as long as we are asking questions:

Why did you match “secant” with “one over COSINE”? And “cosecant”  with “one over SINE”?  Isn’t that making things unnecessarily complicated?

And once again:

What is “co-” about the cosecant?  And the cotangent?

All of these mysteries can be resolved with a single diagram.  I will develop the diagram step-by-step in my next post.  But for now, here it is in the finished form.  Ponder it well…

post27pic9

As you will see in the next posts, there are lots of similar triangles waiting to be discovered in this diagram.  Also, the Pythagorean theorem makes several useful appearances.

But for now, let’s resolve one of the mysteries:

Look at the segments labeled sine, secant and tangent.  Note their positions relative to the central angle, θ.

Now look at the segments labeled cosine, cosecant and cotangent.  Note their positions relative to the central angle 90-θ.  Each of these segments relate to 90-θ the way their corresponding segments relate to θ. And remember that 90-θ is called the “complement” of the angle.  So that’s where these segments get their names:

“the complement’s sine” —> cosine

“the complement’s secant” —> cosecant

“the complement’s tangent” —> cotangent

One mystery solved: “co-” is for “complement” !

More mysteries to be unraveled soon.


Those Flipping Inverse Graphs

"Sometimes the sophisticated thing is easier to understand 
than the kludgey thing. The flipped plots in the books were 
driving me crazy. They don't even pass the dimensional analysis 
test."
 -- John Denker

I have been known to rant occasionally about some of the curriculum choices we have made for high school mathematics.  I feel the math we teach should be useful or interesting, and ideally both.  But it should also be true!  I think of that as the teacher’s equivalent of medical rule: first, do no harm.

What brings this to mind is an email discussion I have been having with Dr. John Denker, a physicist who I have “met” through the Phys-L.org email list.  He has, as you see above, some very reasonable objections to the way that my book repeatedly points out the symmetry between the graph of a function and its inverse.  I would like to discuss his objections here in this post and also to show his suggested alternative. Then, in the spirit of this blog, our email discussion led me to remember a nice method for using graphs to evaluate iterated functions.  I will write about that in another post soon.

[By the way, to any current or future physics teachers out there: I strongly recommend joining the email list Phys-L.  It may be the single most helpful resource I know of, populated by many patient and enthusiastic experts, including Dr. Denker.  My current students can attest to the many occasions when my teaching has been assisted and influenced by ideas I encountered on Phys-L.]

OK, on to those flipping graphs…

CLAIM:  If you graph a function and its inverse on the same axes, the two graphs will have an interesting and esthetically pleasing symmetry with respect to the line y = x.

I am by no means the only one who makes this claim!  Search the web for “inverse function graph symmetry” and you will find that claim stated quite frequently.

For example, consider the squaring function, with its domain restricted to the non-negative real numbers.  It has an inverse function, the square root function, and sure enough, if you graph both functions on the same axes, you see the symmetry that I am talking about:

post24pic3

The graph above was made at www.desmos.com, a very user-friendly graphing site.  And the graph certainly provides evidence in favor of the claim.  And I personally find this to be, as I said, esthetically pleasing.  Also, this idea is not without application.  When you learn a formula for finding derivatives of inverse functions, this symmetry will present a graphical way to understand that formula.  Still, if I had to guess, I suspect that most of the people who write about this claim do it because they like how the graphs look.  They look nice.

OBJECTION #1

“If you graph a function and its inverse…”  But why would you ever do that?  As JD pointed out to me:

I don't think anybody ever needs to flip the axis to form 
the inverse function. Just read the axes in the other order.

That’s a good point.  For example, let’s look again at the squaring function by itself this time.

post24pic5

The graph is a convenient way to represent the relationship between the length of the side of a square and its corresponding area.  But if you already knew the area and wanted the length, you would not need to draw a new graph!  You would just need to know how to read the graph you already have!  You’d start on the vertical, area axis, go over to the curve and then read down to the horizontal axis where you would read the length.  Same graph, different purpose.


BUT STILL…

OK, I don’t need to graph the inverse function.  But what if I just want to because I like how it looks.  Is it wrong?  Does it violate the teacher’s version of the Hippocratic Oath?  Alas, not always, but often, and in a way that I should have considered, seeing as a major theme in my book is how math is actually used in science.  My current students may find it amusing that what I have overlooked are the units!  I may feel like graphing the two functions ON THE SAME AXES, but in most cases, it would be wrong.  Which brings us to…

OBJECTION #2

The flipped graphs do not have the right units on each axis!

You don’t need to use sophisticated physics or chemistry to show this.  Our first graph above with the squaring function and the square root function illustrates the problem sufficiently.  Look again at the vertical axis.  Pick a number.  OK, 2.  But 2 WHAT? Is it inches or square inches? Meters or square meters?  D’oh.

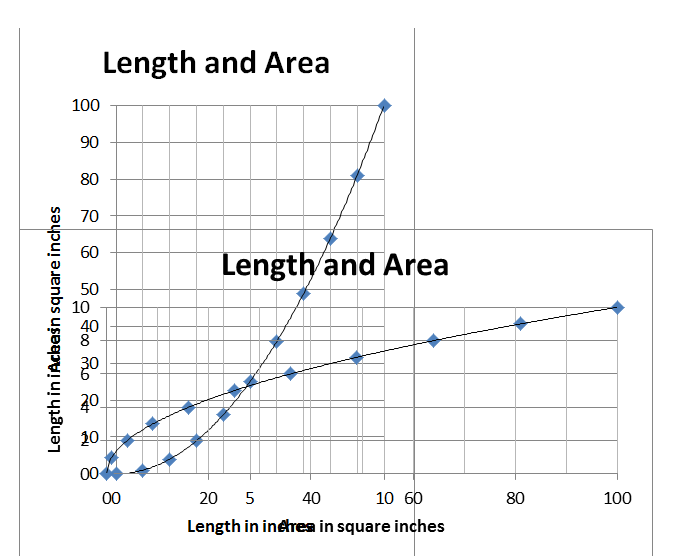
The bottom line is that if your functions represent physical quantities, then those quantities have units.  And unless the units happen to be the same, then you cannot just flip the graph.  You have to flip the axes as well. You just can’t throw those graphs on the same axes.  Look at them side-by-side:

post24pic6

If you want to show the symmetry of the original claim, you could take these two graphs, put them on overhead transparencies and lay one on top of the other:

post24pic7

It’s not as pretty, but at least its not wrong.

When you are focusing on the math, it is easy to forget that these quantities have physical meaning and units that go with them.  For example, there are many books and websites where you can see a function and its derivative graphed on the same axes.  (It’s even done that way on some of the websites that I used in earlier posts about derivatives.)  But that makes no sense!  For example, how can you graph position and velocity on the same axes?  They don’t have the same units.

I did a quick web search for “function derivative graph applet”.  Here is one site (of many) I found that puts the function and derivative on the same axes:

http://www.math.uri.edu/~bkaskosz/flashmo/derplot/

post24pic2

Here’s one that correctly puts them on different axes:

http://www.flashandmath.com/advanced/derdraw/DerivativeDraw.html

post24pic1

These are both very clever websites, good for developing a feel for what a function’s derivative looks like.  But the second one is better — it remembers that these are quantities with units.  (Also, the shading on the derivative graph is a neat bit of fore-shadowing.  That’s a topic for another upcoming post as well.)

Getting back to the Flipping Graphs…

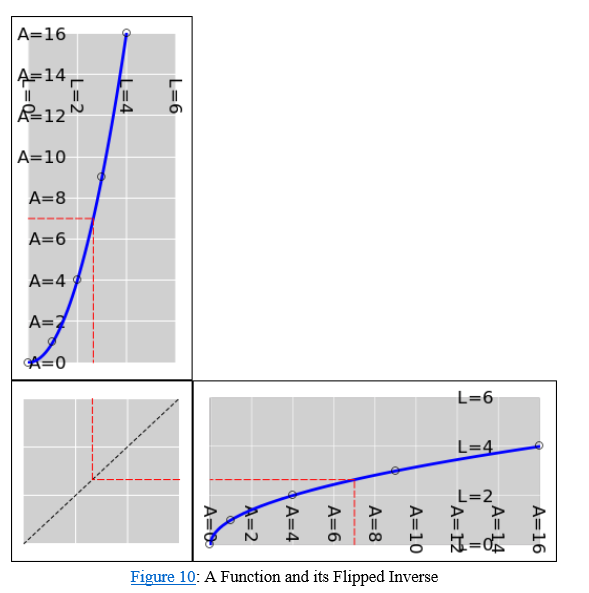
If you don’t like the looks of the two overlaid transparencies, there are some other ways to visualize these functions and their inverses.  John Denker presents a few of them on his website here:

https://www.av8n.com/physics/math-intro.htm#ex-graphs

Here is one diagram (figure 10) from his site that I especially liked:

post24pic4

The “reflector panel” reminded me of another clever method of interpreting graphs.  More on that in a future post…