Exponential Decay and Time Constants

The other day, a colleague showed me a diagram about current vs. time in an RC circuit. The diagram helped me realize that there is another way to think about time constants and exponential decay, a way I had completely overlooked.  I had all the right pieces floating around but I had never put them together. 

WHAT’S A TIME CONSTANT?

Here are three graphs showing a quantity that is decaying exponentially toward zero:

timeconstant3


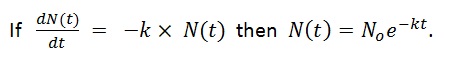
Each of these is a graph of a function: N(t) = Noe-kt

The only difference is the value of the constant, k.  Higher values of k lead, in a sense, to faster decay.

To help emphasize this, we can define a constant: τ = 1/k

Then we can  re-write the function this way: N(t) = Noe-t/τ

We call τ the “time constant” for this decay.  It has the units of time.  And it gives us an intuitive feeling for how fast a function is decaying.

For every time constant that passes, our decaying quantity gets reduced by another factor of e.

So after one time constant has passed, the function’s value is No/e.  After two time constants, it’s No/e2.  After three, No/e3 …and so on.

But there is another way to think about the time constant.

The time constant tells us how long it would take to reach the asymptote at the current rate of change.

Maybe this should have been obvious, but I never thought about that way until just a few days ago. Here’s the diagram that got me started:

timeconstant1

http://www.algebralab.org/practice/practice.aspx?file=Reading_ChargingCapacitor.xml

The claim here is made in the context of a charging capacitor, but it is actually true for any function that is approaching an asymptote exponentially. Here is an animation I made in Desmos to illustrate the point:

In the still picture above, you can see the tangent line at t=0.  The dotted green segment on the t-axis represents the time it would take for the tangent line to reach the asymptote.  When you run the video, you will see the function decrease and the tangent line get shallower.  But that green segment stays the same length.

(If you want to play with the Desmos file, you can get it here🙂

WAIT – WHAT’S A TIME CONSTANT NOW?

A quantity that decays exponentially approaches its final value asymptotically. And as it decays, its rate of decay decreases as well.  (That’s the defining characteristic of exponential decay: the rate of decay toward the final value is proportional to the current distance from that value.  In fact, we can write that as a differential equation. I went on and on about that here.)

But now suppose that at some moment, the decay rate were to become constant. Instead of taking forever, the function would now be able to reach its asymptote in a finite amount of time. Not in just any old amount of time, but in fact in an amount that equals the “time constant” of the decay. It doesn’t matter what moment you pick.  From any starting point during exponential decay, if the rate were to stay constant (which it doesn’t, but still…) the time to reach the asymptote would always comes out to τ = 1/k.

Or to say the same thing geometrically: the tangent line from any point on the curve will intercept the asymptote after one time constant has elapsed. That’s what the animation is trying to emphasize.  I chose a k value of .2 so my time constant was 1/.2 = 5 seconds.  If you open the Desmos file, you can change the constants to see what changes and what doesn’t.

SO WHY DID THIS SURPRISE ME?

I wasn’t making the connection between the exponential decay and the differential equation lurking in the background (even though I teach that connection and have blogged about it).

That the function decreases with a rate of change that is proportional to the value of the function is actually a first-order differential equation.  The exponential decay is its solution. (Again, gory detail here.)

post21pic12

And if slope is rise over run, then run is rise over slope!  When the function is starting from a higher value, the tangent has a slope that is PROPORTIONALLY higher!  So that proportionally higher slope will get you back to the asymptote in the same amount of time every time.

To find how much time we are talking about, divide the “rise” (or in this case, a “fall”) by the slope:

timeconstant4

I’ll leave a more rigorous, math-y proof as an exercise for those of you in your first calculus class.


James Tanton is Still Rolling

And now he asks:

“If I roll a die five times, how many distinct values should I expect to see?”

I was feeling pretty good about myself having solved the first one. (Here) And my Excel simulation told me I was at least close.  But when I attacked this new one, I hit some trouble.  I know I need the expected values, but to get them, I need the probabilities.  And I was bogging down in the calculations.  I could find the probability of getting one distinct value, but two was harder, three harder still…

Simulate first and calculate later

I already had the spreadsheet with the random integers.  But Excel does not have a “number of discrete values on the list” function.  So even there, I was stuck.

[Side note: back in the day when I did know how to code, I briefly knew an obscure programming language called APL.  I believe that in APL, a problem like this can be solved in a single line of code, dense with obscure symbols.  Document your code, campers, or you will never remember what you did!]

But since JT only rolled the dice 5 times, I did eventually come up with a way to have Excel do this for me. Let’s call it the “Go Fish” procedure, naming it after the simple card game.  It’s not very elegant but it works and, as you will see, it pays extra dividends.

For each possible dice value, 1 through 6, I made a column that answered the question: did this value appear on the list. For example, the formula in my first column answers the Go Fish question: got any ones?

=1×or((a2=1),(b2=1),(c2=1),(d2=1),(e2=1))

This generates a value of 1 if any of the dice came up as a 1 and zero if none of them did.

I made a total of 6 columns like this. Then, the sum of those columns tells me how many distinct values appeared in my original 5 rolls of the dice.

From there, it was just a matter of doing this in every row and taking the average. Again I did 10 years worth of rows.

tanton dice excel 2

You can see in the top row that the dice came up: 1, 3, 2, 1, 1

So the answer was yes if the question was got any 1’s, 2’s or 3’s and no for any 4’s, 5’s or 6’s.  That gave a total of 3 distinct values this time.

OK, so now I have a rough idea of the answer. But aren’t I just stalling?  I should get back to work calculating the probabilities and expected values.

[Really, I am stalling.  I should be grading lab reports.]

Then I realized that the procedure I used to generate the answer in the simulation can be used to calculate the answer directly:

Say you want to know the probability that your list contains a 1. That is more easily calculated as 1 minus the probability that it contains no 1’s.

P(got any ones) = 1 – (5/6)5

But that is also the probability for any of the single Go Fish questions:

P(got any ones) = P(got any twos) = P(got any threes)…and so on.

So the expected value of the total of the “Go Fish” questions = 6 times the value for any one of them!

That means we expect 6×(1 – (5/6)5) = 3.589 different results every time.

That’s not far from what the simulation told me to expect. I ran it 5 more times and got:

3.584, 3.591, 3.586, 3.587, 3.595

So I am feeling like this is a promising answer. I would still like to go back and finish calculating the probabilities the hard way.  But the point to notice here is that taking the time to simulate the problem also provided the key to a solution path.

James Tanton is on a Roll

A good puzzle is a torment.  And there is something interesting about probability puzzles in particular:  you can’t always tell how tricky they are until you dig into them for a while.  Sometimes a question that seems quite tractable ends up eating up more time and more note paper than you were expecting.

James Tanton has been dropping puzzle after tormenting puzzle on Twitter over these past weeks.  The first one was interesting – and I think I have it solved.  But he was just getting started.

I roll 5 dice every day for a year, recording my high score each day.  At the end of the year, I average those high scores.  What average should I expect?

What we need here is the expected value of the high scores. So first we need the probability of each high score.  Then we can multiply each of those probabilities by its corresponding score.  The sum of those products will be our expected average.

What is the probability of a high score of 1?

Well, you would have to get a 1 every time.  That probability is (1/6)5.  So we can write:

P(high score is 1) = (1/6)5.

What is the probability of a high score of 2?

Now you need a 1 or a 2 every time. That probability is (2/6)5.  But wait!  That includes the cases that turn out to be only 1’s.  But we can subtract the probability we just calculated above to get the probability we want:

P(high score is 2) = (2/6)5  – (1/6)5.

What is the probability of a high score of 3?

We use the same plan: find the probability of getting a high score of as much as 3, subtract the probability of getting a high score of as much as 2  and we will be left with the probability of getting a high score of exactly 3:

P(high score is 3) = (3/6)5  – (2/6)5.

And now we have a pattern to follow:

P(high score is 4) = (4/6)5  – (3/6)5.

P(high score is 5) = (5/6)5  – (4/6)5.

P(high score is 3) = (6/6)5  – (5/6)5.

OK, then we go ahead and multiply each probability by its score and add them up!

When we do, we get an expected value of:

6 – (5/6)5 – (4/6)5 – (3/6)5 – (2/6)5 – (1/6)5 = 5.431

BUT IS THAT RIGHT? Hmm…

I suppose a short computer program could test this. It’s been years since I have written code.  But there’s this program called Excel. And it has a random-integer-generating function. [I used Randbetween(1,6) ]

tanton dice excel 1

As you can see, I actually simulated 10 years of dice rolls. And then I did it again.  And again. And again…The last 5 times I did this, I got 5.4055, 5.4127, 5.4389, 5.4477 and 5.4211.

So I believe I am on the right track. Flush with success, I see on Twitter that Mr. Tanton has posted again:

“If I roll a die five times, how many distinct values should I expect to see?”

Well, how much harder can this be? Ha!  Stay tuned…here it is!